Which numbers should clinic management track? Formulas and report routine
Published 23 October 2026Reviewed 23 October 20267 min read
On this page
Formula table
These are the common, simple definitions. What matters is deciding once and using the same definition every period; if you change it you cannot compare with the past.
- Enquiry count
- FormulaNew enquiries recorded in the period
- How oftenWeekly
- How to read itRead it by source, not alone
- Spread by source
- FormulaEnquiries from a source / total enquiries
- How oftenMonthly
- How to read itFind the source with many enquiries but few patients
- First response time (median)
- FormulaMedian of the time from recording an enquiry to first contact
- How oftenWeekly
- How to read itUse the median, not the mean; outliers distort the mean
- Share missing the response target
- FormulaEnquiries that missed the target / total enquiries
- How oftenWeekly
- How to read itLook at in-hours and out-of-hours separately
- Conversion to quote
- FormulaEnquiries that received a quote / enquiries
- How oftenMonthly
- How to read itSplit by service
- Quote acceptance rate
- FormulaQuotes accepted / quotes sent
- How oftenMonthly
- How to read itQuotes sent and accepted may fall in different months; follow the same cohort
- Overall conversion
- FormulaPatients who came for treatment / enquiries
- How oftenMonthly
- How to read itRead it with patient acquisition cost
- Average treatment value
- FormulaTotal of accepted quotes / number of accepted quotes
- How oftenMonthly
- How to read itCompute each currency separately; do not convert
- No-show rate
- FormulaMissed appointments / (attended + missed appointments)
- How oftenMonthly
- How to read itRescheduled ones are not no-shows; split by type and source
- Collections
- FormulaPayments received in the period (per currency)
- How oftenMonthly
- How to read itCompare the total accepted with the amount received
- Collection completion
- FormulaAmount received / amount due
- How oftenMonthly
- How to read itList what is due but unpaid
- Aftercare response rate
- FormulaPatients who answered / patients sent a check-in
- How oftenMonthly
- How to read itHave a rule for calling non-responders
- Patient acquisition cost
- FormulaMarketing spend / number of new patients
- How oftenMonthly
- How to read itCompute by source; looking only at first-touch source can mislead
Why does each metric matter?
Enquiry count shows the size of demand and the spread by source shows where your money goes; a source that brings many enquiries may bring few patients. So follow the source from enquiry through to treatment. First response time is the most controllable part of winning a patient; setting a target and seeing who missed it makes a difference fast.
Conversion to quote and quote acceptance rate are two separate links in the sales process. If conversion to quote is low, the problem may be in intake or in reaching the patient; if acceptance is low, it may be the quote itself, its price or the follow-up. Without separating them the numbers cannot be interpreted.
Average treatment value and collections show the money side. Do not add or convert currencies; read each on its own. No-show rate shows lost capacity, and aftercare response rate shows whether follow-up is being kept up.
How do you break the numbers down?
A total often hides the problem. These breakdowns turn a number into an action.
- Source and campaign
- What it showsWhich channel brings patients
- Example questionDoes the source with most enquiries bring most treatments?
- Service
- What it showsWhere in the process a service gets stuck
- Example questionWhich service has a low acceptance rate?
- Country and language
- What it showsWhich market behaves differently
- Example questionIn which language is our response time long?
- Owner
- What it showsWorkload and how the process is spread
- Example questionIs the problem a person or the rota?
- Location and doctor
- What it showsCapacity and appointment yield
- Example questionWhich site has a high no-show rate?
- Time
- What it showsTrend
- Example questionCompare this month with last month, or with the same season?
A weekly and monthly report routine
- Weekly (15 minutes)
- Who looksCoordinators and the manager
- What is in itNew enquiries, median first response time, those that missed the target, quotes sent and unopened, next week’s appointments and arrivals
- DecisionWho owns the late cases, what do we fix this week
- Monthly (45 minutes)
- Who looksManagement and finance
- What is in itConversion by source, quote acceptance, average treatment value, collections and overdue amounts, no-show rate, aftercare response, reasons for loss
- DecisionWhere does marketing budget go, what capacity for which service, which process changes
- Quarterly
- Who looksOwner / board
- What is in itTrends, progress against targets, profitability by service and market
- DecisionUpdate targets, investment and hiring
How do you set up your first report?
Choose five metrics
Start with first response time, quote acceptance rate, no-show rate, collections and enquiries by source. This is enough for most clinics.
Write the definitions
What does an enquiry count? Which date is used? Does a second enquiry from the same person count? Keep it written down.
Take a baseline
Calculate the last three months with the same definitions; that is your own reference.
Name an owner
Each metric gets an owner and a day on which it is reviewed.
Set a small target
Pick an achievable improvement on the baseline; unrealistic targets make people stop measuring.
Repeat monthly in the same way
Follow the trend without changing the definition.
How do you do it in Klinikbook?
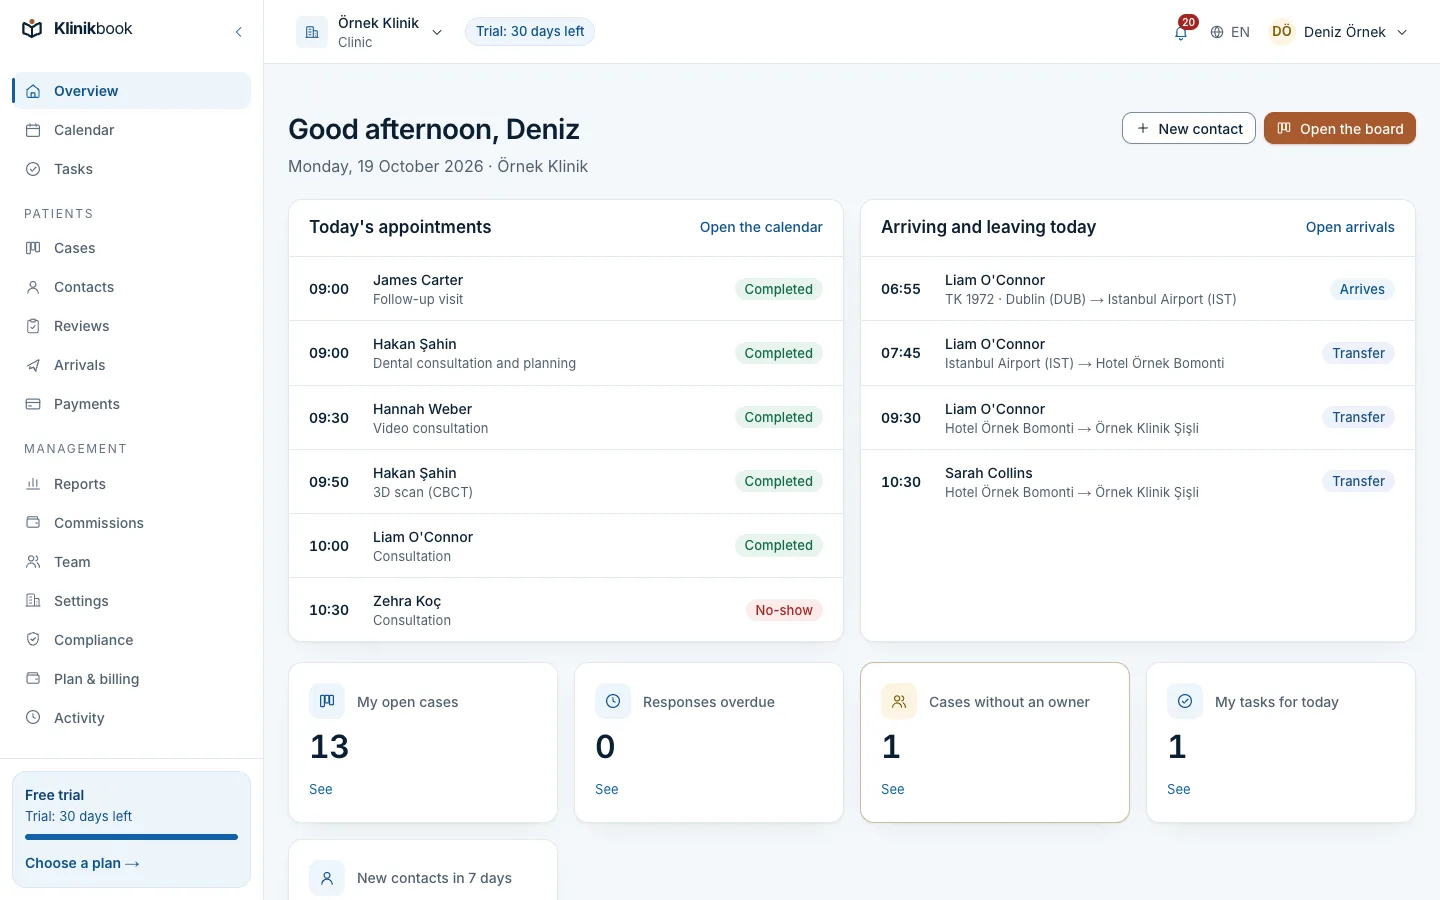
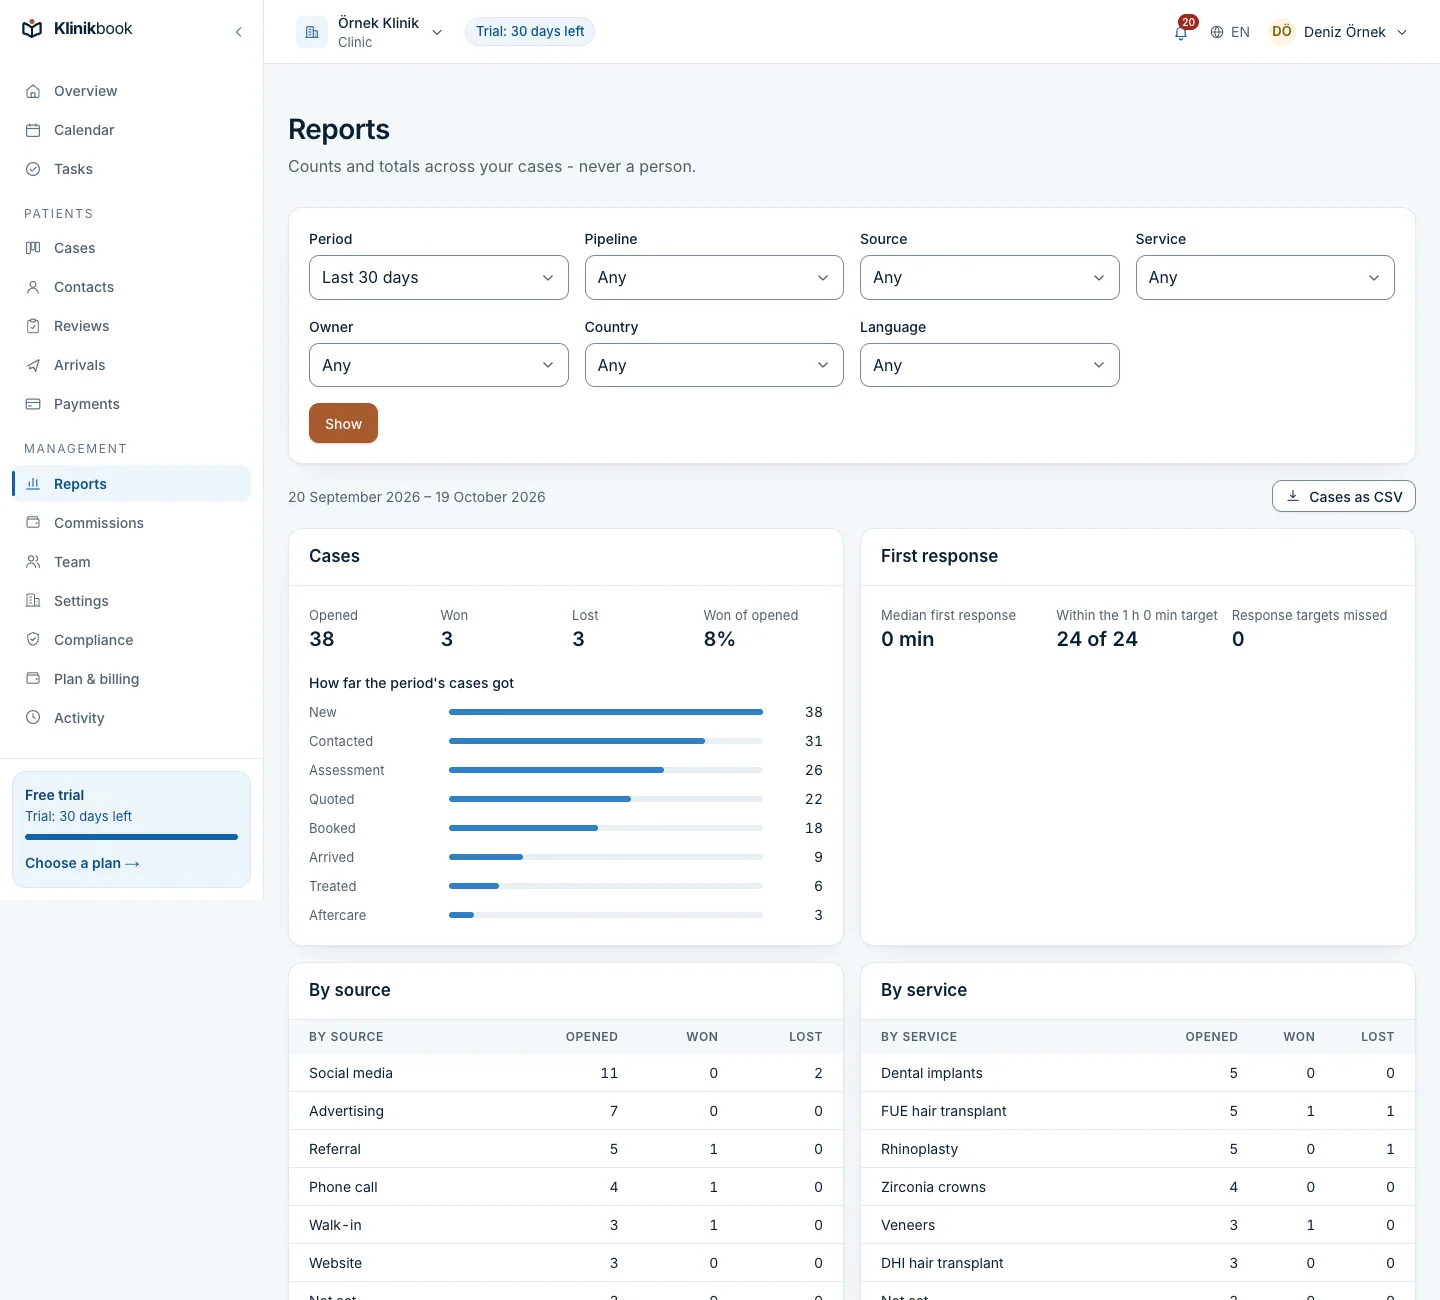
Open Reports
Pick the period (such as the last 30 days); filters live in the address, so a report can be shared as a link.
Read funnels by source, campaign and service
Cases opened, contacted, quoted, booked, treated, won and lost; the campaign comes from the first touch’s utm_campaign.
Follow trends and times
Cases opened, won and lost per day, week or month; the median time to first reply and to booking.
Read money by currency
Quotes sent and accepted and payments received and refunded appear per currency, with no conversion.
Check the no-show rate and member results
The no-show rate shows how many of the visits that were due were missed; member results show each member’s cases and median times.
Download and share
The cases behind a report download as CSV; reports follow record visibility rules, so a member only reports on the records they are allowed to see.
Frequently asked questions
Which numbers should a clinic track?
Enquiry count and source, first response time, conversion to quote and quote acceptance rate, average treatment value, no-show rate, collections and aftercare response rate. Start with five and add as needed.
How do you calculate quote acceptance rate?
Divide the number of accepted quotes by the number of quotes sent. Because quotes sent in one month can be accepted in the next, following the same cohort is more accurate.
How do you calculate the no-show rate?
Divide missed appointments by attended plus missed appointments. Do not count rescheduled ones; track late cancellations separately.
What is a good conversion rate?
There is no value that fits everyone; conversion varies widely with service, source and market. First take your own baseline, then follow it monthly with the same definition.
Why is the median better than the average?
A few very late replies raise the average and hide the typical experience. The median tells you half of enquiries were answered faster than that.
How do you track revenue in different currencies?
Do not add currencies or convert them; read each on its own. Exchange-rate movement distorts the result.
Do I need separate software to prepare reports?
A spreadsheet can do it, but if source, quote and appointment data are scattered, building the report keeps costing effort. Klinikbook’s reports come ready from the same data.
Sources
- No-shows in appointment scheduling – a systematic literature review (Dantas et al.) — Health Policy, vol. 122, no. 4, 2018
See your numbers on one screen
Reports from source to collection are in every Klinikbook plan. 30 days free, no card needed.
Related reading
Free tools
30-day free trial
Try Klinikbook with your own team
Every feature is open for 30 days, and no card is needed to start.